
Understand the Probe's Delay
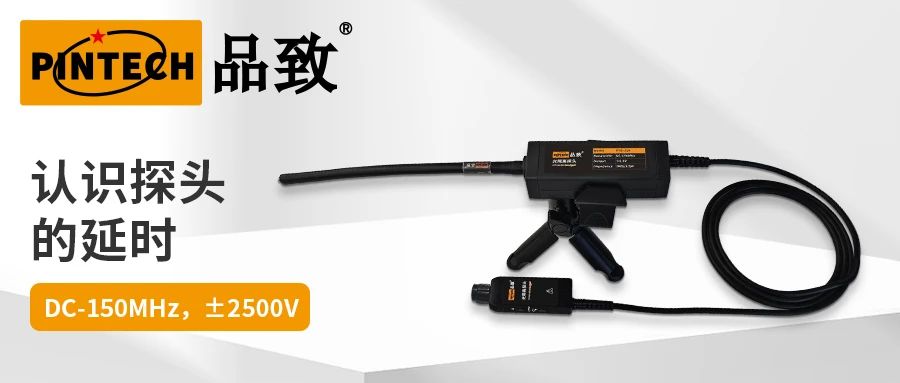
Probe delay refers to the time interval between the signal being transmitted from the measurement point and reaching the oscilloscope input. Specifically, it is the total time delay incurred as the signal traverses the probe tip, transmission cable, internal circuitry, and other pathways before arriving at the oscilloscope's sampling system. (The following discussion focuses on low-speed signal scenarios, disregarding ps level delay errors between oscilloscope channels). Different probe delay exist difference. Particularly when active and passive probes are used together, significant relative delays can cause waveform misalignment visible on the oscilloscope.
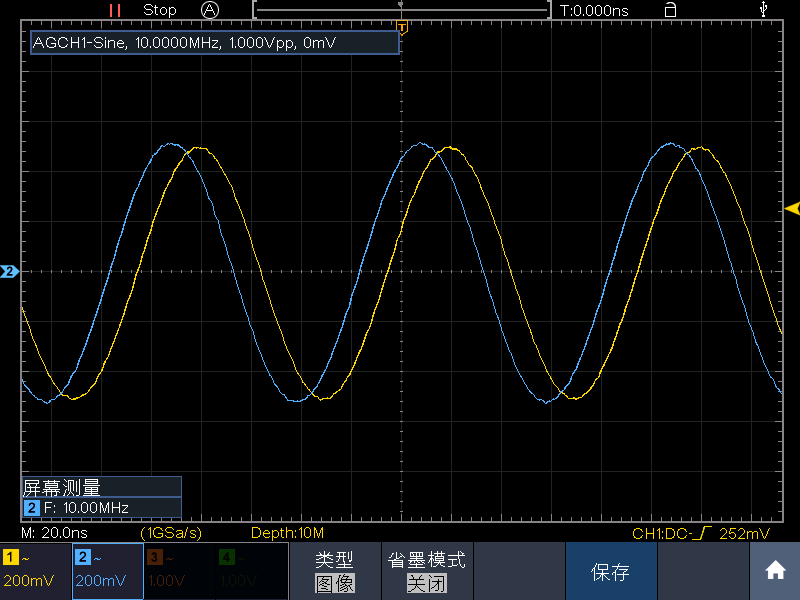
Figure 1: Misalignment occurs when active probe (CH1) and passive probe (CH2) simultaneously measure a 10MHz sine wave.
Numerous factors influence probe delay, such as the material and length of the connecting cable, as well as the probe's internal circuitry. When performing multi-channel synchronous signal measurements, it is essential to first measure the relative delays between different probes. For multi-channel synchronous measurements of high-speed signals (such as high-frequency pulses or high-speed digital signals), in addition to variations in probe delay, the inherent channel-to-channel delay within the oscilloscope itself must also be considered to avoid compromising signal characteristic analysis.
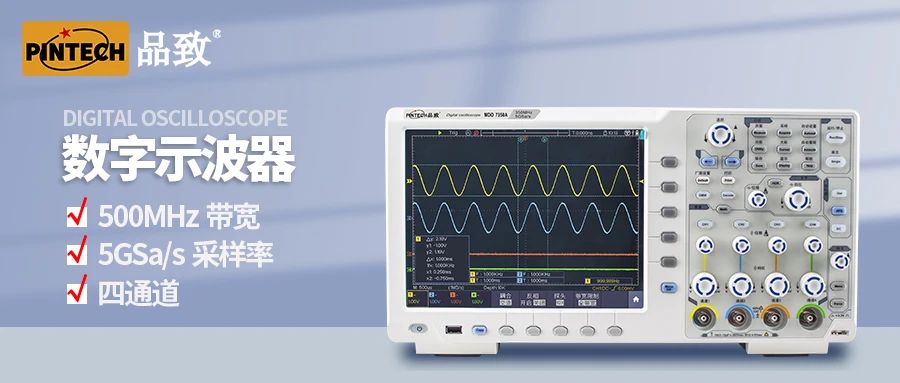
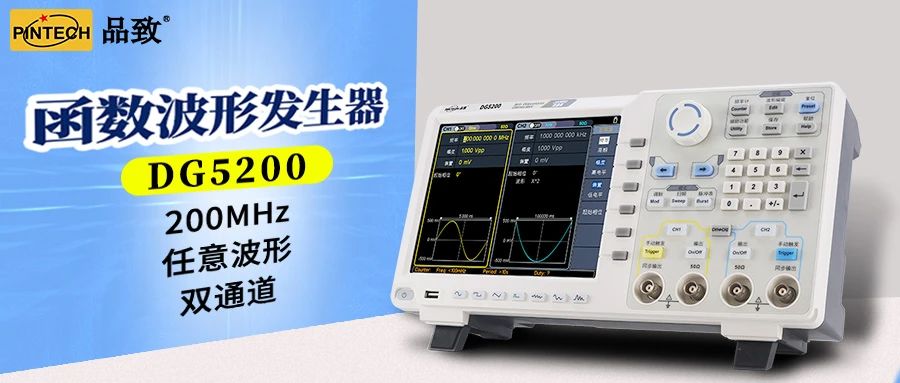
You can choose to use a signal generator to produce a fast-edge pulse signal or the built-in square wave signal from the oscilloscope to measure the relative delay between different probes. Typically, the front panel of the oscilloscope features a calibration signal output port that generates a calibration square wave, which can be used for calibrating the oscilloscope probes. Simply connect both probes to the same signal source. You can manually measure the time difference between the two channel waveforms by adjusting the cursors, or use the rising edge/falling edge delay measurement function in the measurement tools. This automatically identifies characteristic points in the signals of both channels and calculates the time difference. The measured signal in the figure is generated by a signal generator, consisting of a square wave with a frequency of 1 kHz and a peak-to-peak voltage of 1 Vpp. Manual measurement using cursors indicates a rising edge delay of 11.2 ns, while automatic measurement shows a rising edge delay of 10.2 ns, representing the relative delay between signals across the two channels.
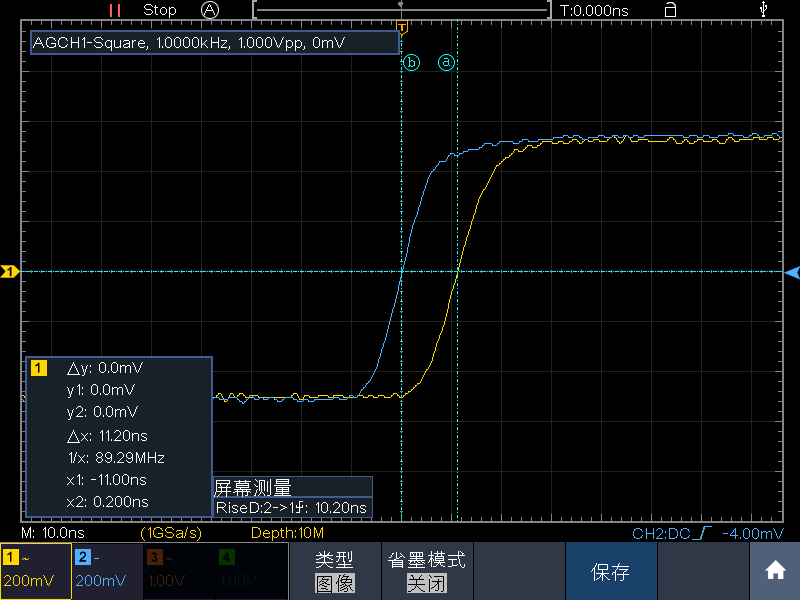
Figure 2: Comparison of the same square wave tested with different probes